Quantification of Bone and Cartilage Imaging Biomarkers in Clinical Studies of Osteoarthritis

Erik Dam, PhD
The KneeIQ framework from Biomediq offers automatic, computer-based analysis of knee MRI for use in clinical studies of Osteoarthritis with a focus on phase II and phase III studies.
- The package provides:
- Fully automatic segmentation of bone and cartilage from Knee MRI.
- Biomarkers of cartilage morphometry including cartilage quantity markers (volume, thickness) and more advanced markers related to biomechanics (contact area, congruity) and cartilage quality (smoothness, homogeneity).
- Novel markers of trabecular bone structure (predictive of cartilage loss).
The patented KneeIQ marker suite provides prognostic markers for study population selection as well as efficacy markers. The markers have been validated and demonstrated in publications against radiological gold standard, clinical outcomes as well as against biochemical markers. The efficacy markers have been used successfully in a phase III DMOAD multi-center study, where treatment efficacy was demonstrated from our cartilage volume markers.
Our methodologies are continuously being validated and matured in collaboration with clinical partners. Currently, we are a partner in the D-BOARD consortium, an EU FP7 project. For D-BOARD info, visit d-board.eu.
Automatic Segmentation of Bone and Cartilage in Knee MRI
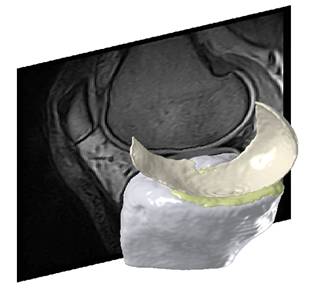
The KneeIQ framework is founded on a flexible model of the knee joint that allows inclusion of multiple bone and cartilage compartments. This adaptable, statistical shape model and the segmentation framework is the result of a decade of research in academia and in Biomediq. The framework is trained on expert manual segmentations and learns the structure and shape of the included compartments.
The methodology is well published1-5 and the segmentation quality has been demonstrated on several studies with varying populations, scanners, and sequences (to the right, an example from a non-treatment community study using low-field MRI (0.18T Esaote C-Span, Sag Turbo 3D T1). It was demonstrated that the accuracy of the segmentation framework is similar to manual expert segmentations, while the scan-rescan precision was equivalent or slightly better than manual segmentations2.
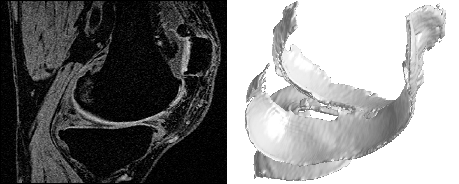
An example from a Synarc study using high-field MRI (1.5T GE Signa Excite, Sag 3D T1 FS SPGR) and including more cartilage compartments is shown below:
Biomarkers of Cartilage Morphometry
The FDA approved efficacy marker for OA clinical trials has been joint space narrowing (JSN), but limited sensitivity and lack of correlation with clinical outcomes demonstrates the need for MRI.
KneeIQ includes a comprehensive suite of cartilage morphometry biomarkers including markers of cartilage quantity (volume and thickness) as well as more sophisticated markers of surface smoothness and most recently joint congruity (oral presentation at OARSI 2011). The markers are validated and documented1,2,6-9.
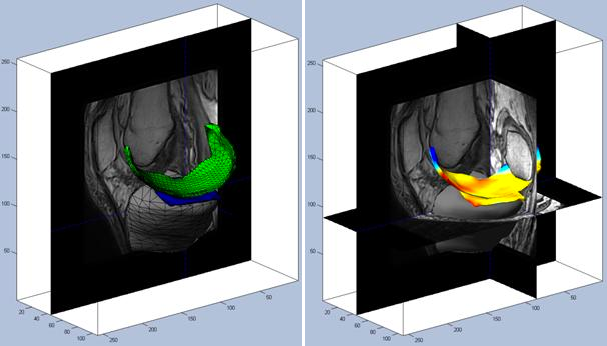
The KneeIQ cartilage volume markers were used in a phase III clinical trial and successfully demonstrated treatment efficacy in terms of prevention of cartilage loss (presented in oral presentation at OARSI 2011).
Bone Structure Analysis
In recent years, the investigation of the role of the bone in OA has gone far beyond osteophytes observed in radiographs. Research into shape analysis and bone quality has been initiated. The preferred modality for bone quality research has been CT or even micro-CT making it more suited for academic research in small cohorts or ex-vivo studies rather than proper clinical trials.
In Biomediq, we have developed a method for analysis of the trabecular structure from MRI that allows clear separation of healthy and OA knees. More importantly, the bone structure marker also allows prediction of the fast progressors (in terms of longitudinal cartilage loss) making it suited for study population selection (oral presentation at OARSI 2011)14. This means that trabecular structure can now be investigated from the standard MRI sequences.
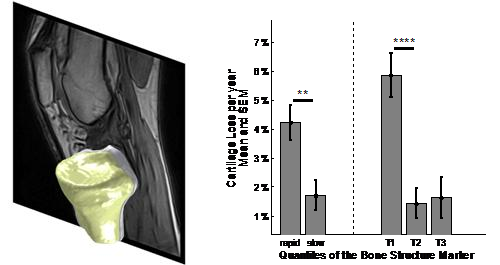
It has been speculated that some OA trials failed because of lack of progression in the study population rather than due to lack of treatment efficacy. In general, without progression in the control group, DMOAD trials are problematic. This suggests that the standard inclusion criteria with a focus on Kellgren & Lawrence grade 2 and 3 are insufficient. The figure above demonstrates that more targeted screening can increase the yearly cartilage loss by several percentage points - allowing the treatment effect to be investigated properly.
Biomechanical markers: Contact Area, Smoothness, Congruity
The Biomediq researchers have published a number of papers on analysis of the cartilage surfaces with a focus on smoothness6,8,10. Most recently, we have developed markers for quantification of the joint contact area and the joint congruity13.
Combining Imaging and Biochemical Markers
The investigation of mode of action naturally involves biomarkers beyond imaging. In Biomediq, we were the first to demonstrate the potential in combining biochemical markers and MRI markers into superior aggregate markers11. Specifically, we showed that the aggregate marker could predict OA progression. Another contribution to investigation into OA risk factors was the study demonstrating that elevated urinary levels of collagen type II were predictive of increased cartilage loss12.
References
- Dam EB, Folkesson J, Pettersen PC, and Christiansen C. Automatic morphometric cartilage quantification in the medial tibial plateau from MRI for osteoarthritis grading. Osteoarthritis and Cartilage 2007; 15(7):808-818.
- Folkesson J, Dam EB, Olsen OF, Pettersen PC, and Christiansen C. Segmenting Articular Cartilage Automatically Using a Voxel Classification Approach. IEEE Trans.on Medical Imaging 2007; 26(1):106-115.
- Folkesson J, Dam EB, Olsen OF, Pettersen PC, and Christiansen C. Position Normalization in Automatic Cartilage Segmentation. MICCAI Joint Disease Workshop 2006; 9-16.
- Dam EB, Folkesson J, Loog M, Pettersen PC, and Christiansen C. Efficient Automatic Cartilage Segmentation. MICCAI Joint Disease Workshop 2006; 88-95.
- Folkesson J, Dam EB, Olsen OF, Pettersen P, and Christiansen C. Automatic Segmentation of the Articular Cartilage in Knee MRI Using a Hierarchical Multiclass Classification Scheme. 2005.
- Tummala S, Bay-Jensen AC, Karsdal MA, and Dam EB. Diagnosis of Osteoarthritis by Cartilage Surface Smoothness Quantified Automatically from Knee MRI. Cartilage 2011; 2(1):50.
- Dam EB, Fletcher PT, and Pizer SM. Automatic Shape Modeling based on Principal Geodesic Analysis Bootstrapping. Medical Image Analysis 2008; 12(2):136-151.
- Folkesson J, Dam EB, Olsen OF, Karsdal MA, Pettersen PC, and Christiansen C. Automatic quantification of local and global articular cartilage surface curvature: biomarkers for osteoarthritis? Magn Reson.Med 2008; 59(6):1340-1346.
- Dam EB, Folkesson J, Pettersen PC, and Christiansen C. Automatic Cartilage Thickness Quantification using a Statistical Shape Model. MICCAI Joint Disease Workshop 2006; http://www.diku.dk/~erikdam/joint 42-49.
- Folkesson J, Dam EB, Olsen OF, and Christiansen C. Accuracy evaluation of automatic quantification of the articular cartilage surface curvature from MRI. Acad Radiol 2007; 14(10):1221-1228.
- Dam EB, Loog M, Christiansen C, Byrjalsen I, Folkesson J, Nielsen M et al. Identification of Progressors in Osteoarthritis by Combining Biochemical and MRI-based Markers. Arthritis Research and Therapy 2009; Accepted.
- Dam EB, Byrjalsen I, Karsdal MA, Qvist P, and Christiansen C. Increased urinary excretion of C-telopeptides of type II collagen (CTX-II) predicts cartilage loss over 21 months by MRI. Osteoarthritis Cartilage 2009; 17:384-389.
- Tummala, Nielsen, Lillholm, Christiansen, Dam. Automatic Quantification of Tibio-Femoral Contact Area and Congruity. IEEE Transactions in Medical Imaging, 2012, 31 (7), 1404-12.
- Marques, Genant, Lillholm, Dam. Diagnosis of osteoarthritis and prognosis of tibial cartilage loss by quantification of trabecular Tibia bone from MRI. Magnetic Resonance in Medicine, 2013, 70 (2), 568-575.